Home / Solutions / Industry × Solution
IT & Software · Business Analytics & Performance Management

IT & Software Business Analytics & Performance Management Solutions

Turn operational and business data into useful insights with dashboards, reporting and performance analytics. Understand project delivery, sales pipelines, service performance and business trends.

⌕
Understand the need Start with business requirements
◇
Evaluate options Choose a suitable approach
↗
Plan next steps Define scope and priorities
Solution overview

Business Analytics & Performance Management

Explore the relevant capabilities, benefits and implementation considerations for your business.

01 / OVERVIEW

Business Analytics for IT Companies
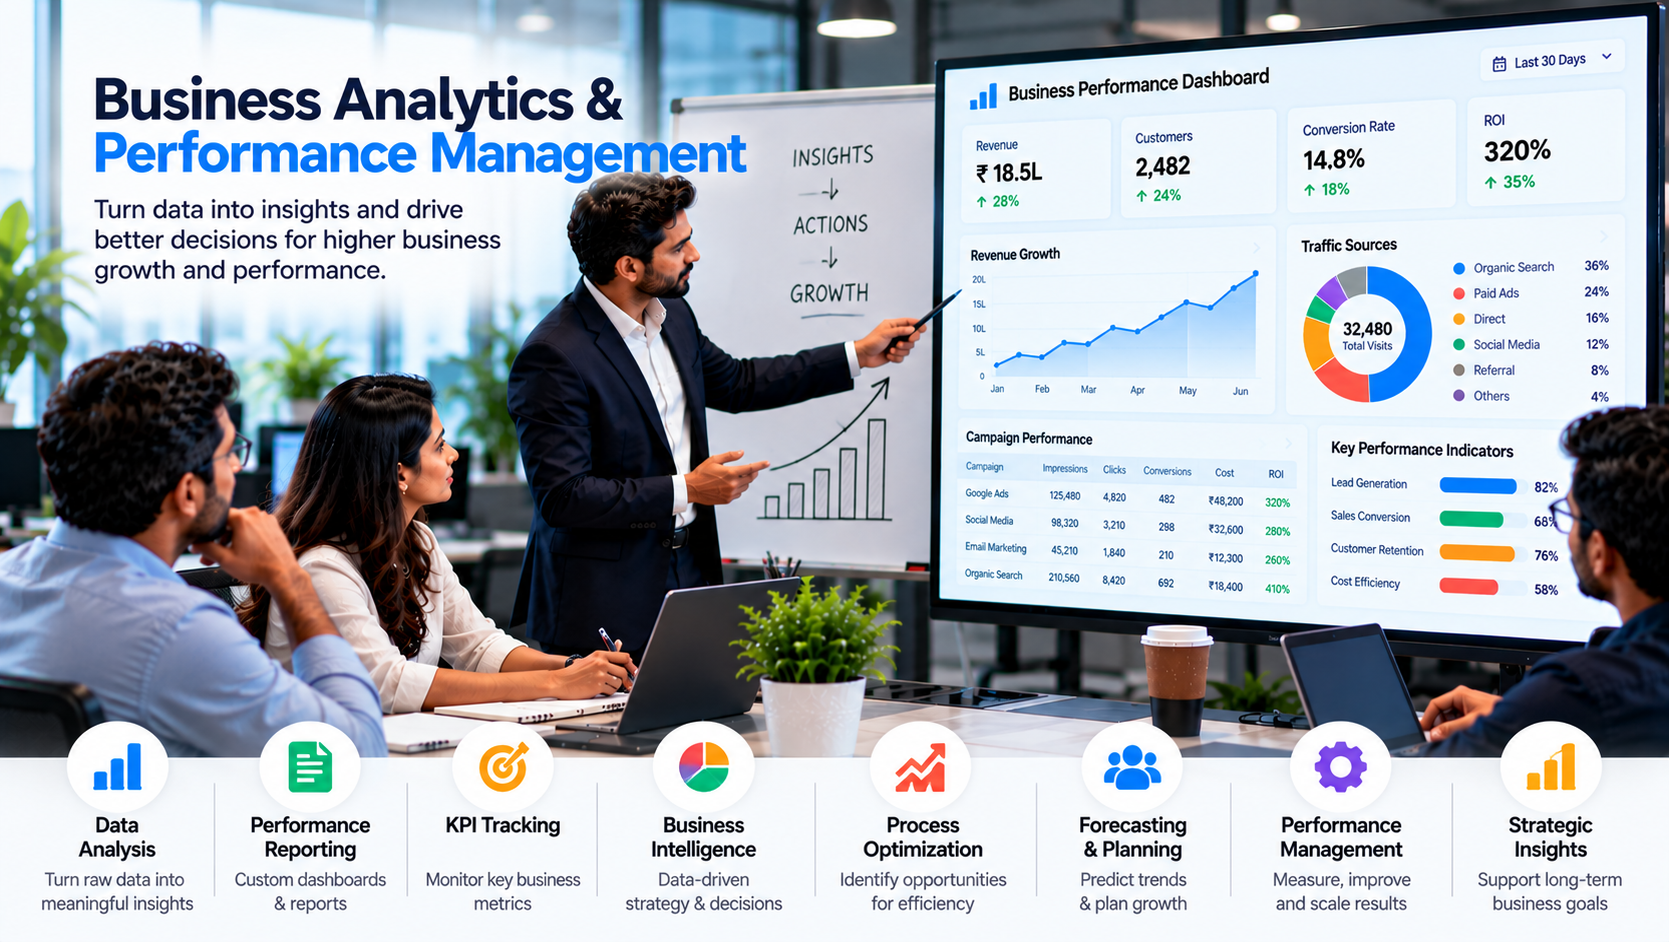
Business Analytics & Performance Management for IT & Software

Reliable reporting helps IT businesses understand commercial performance and delivery operations. Consolidated dashboards can make important information easier to review and act upon.

02 / OVERVIEW

Analytics and Reporting Areas

  • Sales pipeline and lead conversion
  • Project progress and delivery status
  • Service enquiries and support trends
  • Revenue and client performance
  • Team workload and operational indicators
  • Management dashboards and periodic reports
03 / OVERVIEW

From Data to Decisions

We help organise relevant business data into meaningful reports. The focus is on consistent definitions, useful indicators and clear presentation rather than disconnected spreadsheets.

04 / OVERVIEW

Reporting Framework

We review available data sources, identify key performance indicators and plan dashboards that support management reviews and day-to-day decisions.

Our approach

Start with the real problem, then shape a practical solution.

We review the current experience, agree on useful improvements and plan a scope your team can maintain.

01 / UNDERSTAND

Understand your needs

Identify your objectives, current process and the problem you want to solve.

02 / EVALUATE

Evaluate the options

Review suitable services, requirements, scope and implementation priorities.

03 / PLAN

Plan the solution

Discuss the next steps based on your business needs and available resources.

Frequently asked questions

Useful things to know before getting started.

What can an IT business analytics dashboard show?

It can show sales pipeline, lead conversion, project status, support trends and other agreed business indicators.

Can data from multiple sources be combined?

Data consolidation can be planned based on source systems, access and integration feasibility.

Can reports be customised for management?

Yes. Reports can be organised around the indicators and review requirements of management teams.

Do analytics solutions require clean data?

Consistent and reliable source data improves reporting quality. Data gaps should be assessed during planning.

Let's discuss your business requirements.

Tell us what you want to improve and what success would look like for your business. Noivo Tech can help you evaluate the next practical step.

Contact Noivo Tech ↗