Home / Solutions / Industry × Solution
Banking & Financial Services · Business Analytics & Performance Management

Banking & Financial Services Business Analytics & Performance Management Solutions

Bring business and operational information together through dashboards and performance reports. Track enquiries, service activity, customer trends and business indicators to support informed management decisions.

⌕
Understand the need Start with business requirements
◇
Evaluate options Choose a suitable approach
↗
Plan next steps Define scope and priorities
Solution overview

Business Analytics & Performance Management

Explore the relevant capabilities, benefits and implementation considerations for your business.

01 / OVERVIEW

Business Analytics for Banking and Financial Services
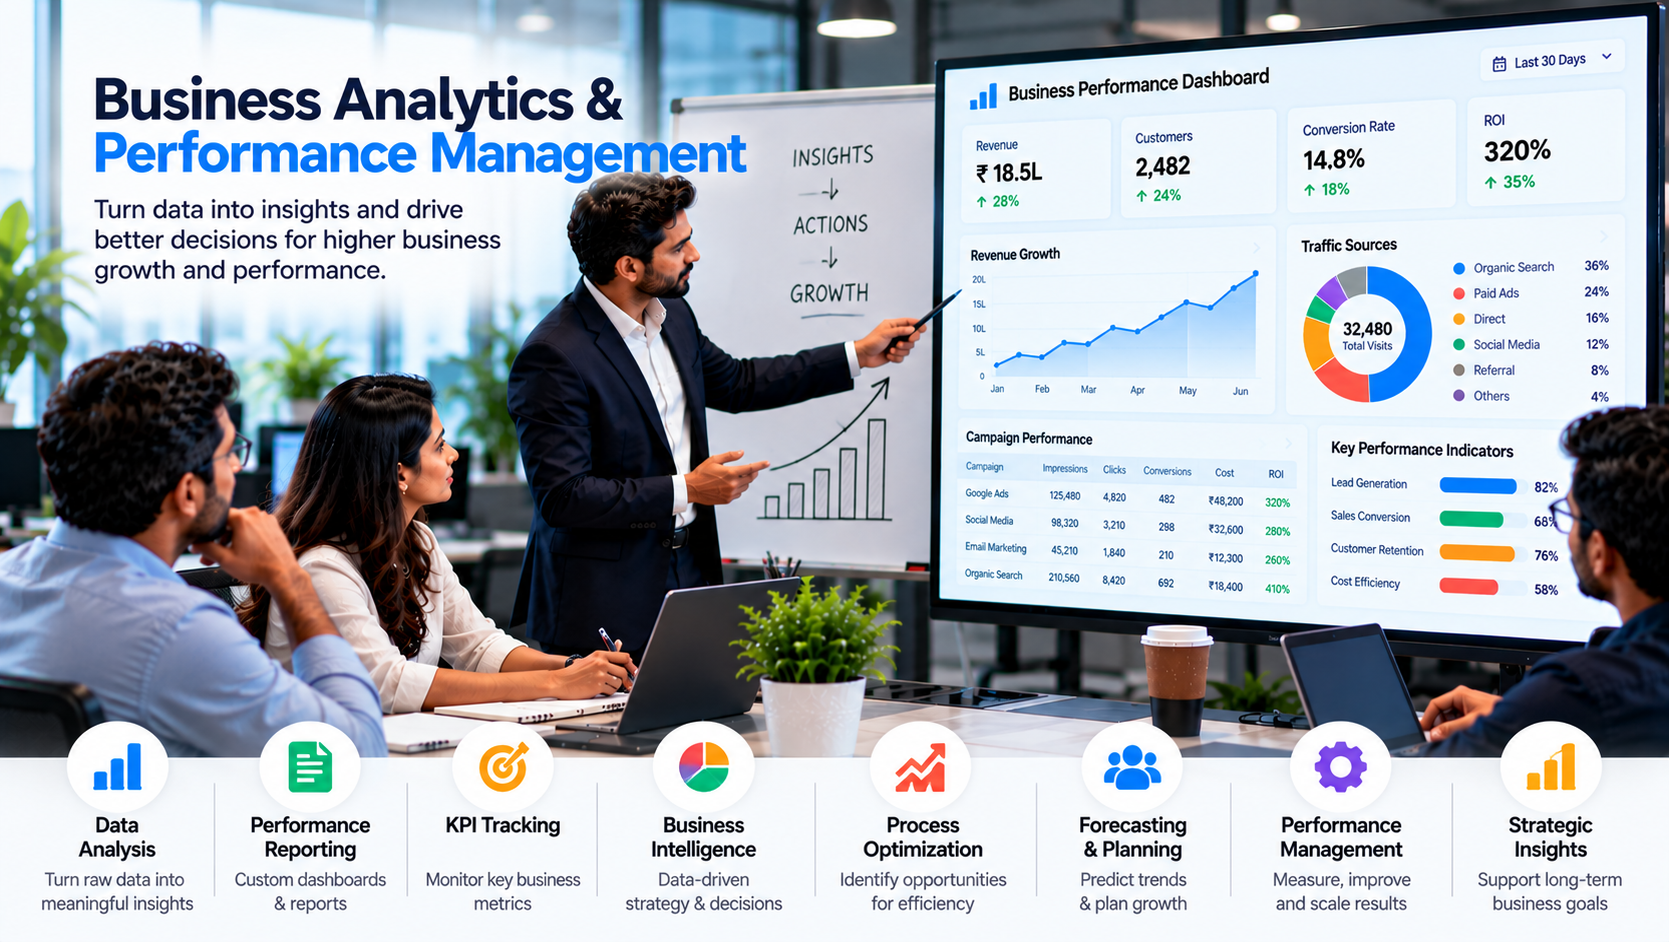
Business Analytics & Performance Management for Banking & Financial Services

Management teams need organised information to understand business activity and service performance. Dashboards and reports can bring relevant operational indicators into a consistent view.

02 / OVERVIEW

Reporting and Analytics Areas

  • Customer enquiry and conversion trends
  • Service request volumes and status
  • Channel and campaign performance
  • Operational turnaround indicators
  • Customer support activity
  • Management dashboards and periodic reports
03 / OVERVIEW

Consistent Business Information

Useful analytics depend on reliable source data, clear metric definitions and appropriate access controls. Reports should distinguish operational indicators from regulated financial or risk measures.

04 / OVERVIEW

Dashboard Development

We identify reporting requirements, review available data sources and plan dashboards around management questions and business priorities.

Our approach

Start with the real problem, then shape a practical solution.

We review the current experience, agree on useful improvements and plan a scope your team can maintain.

01 / UNDERSTAND

Understand your needs

Identify your objectives, current process and the problem you want to solve.

02 / EVALUATE

Evaluate the options

Review suitable services, requirements, scope and implementation priorities.

03 / PLAN

Plan the solution

Discuss the next steps based on your business needs and available resources.

Frequently asked questions

Useful things to know before getting started.

What can a financial services dashboard display?

It may display enquiry trends, service activity, campaign performance and agreed operational indicators.

Can reports combine data from different systems?

Data consolidation can be assessed based on source system access, data quality and integration feasibility.

Can management reports be customised?

Yes. Reporting can be organised around management priorities and clearly defined metrics.

Does analytics replace financial or risk reporting controls?

No. Regulated reporting and risk calculations require appropriate domain validation and professional oversight.

Let's discuss your business requirements.

Tell us what you want to improve and what success would look like for your business. Noivo Tech can help you evaluate the next practical step.

Contact Noivo Tech ↗